Observe, Learn, Act

To share and learn trading ideas on stocks, options, futures, warrants, forex, etc ... Mainly dedicated in analyzing Tech

Friday, October 31, 2008

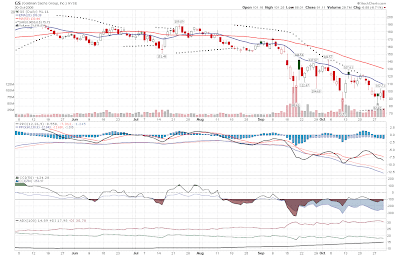
Why was Goldman Sachs falling when the markets were climbing?

GS is one of the few that went down hard on Thursday while in general the markets were up including financials ... what is going to happen???


Wednesday, October 29, 2008

Nasdaq-100 index movement Oct 29th, 2008

I wanted to show what happen to price when faced resistence.  Below is the intraday chart for NDX and its daily chart.  The daily chart actually got to the 20EMA resistence, from the intraday chart we can see how strong the resistence was.  The bulls were slammed twice after 3pm


Tuesday, October 28, 2008

AIG & WaMu (WM)


For WaMu, April 14th, 2008 was the last time a bullish signal can be hoped for, from that point and all, all the signals are pointing down.  The moving averages are all in bearish orientation.  There was absolutely no reason that I can think of to be bullish on WaMu.


Now for AIG, the last time the MACD indicator was positive was the beginning of May, 2008.  However the other indicators did not point to a bullish signal, therefore we were not supposed to be bullish at all at this stock, at least nowhere in 2008.  There were actually quite a some short opportunities for these financial stocks.  If you are afraid the risk of a short squeeze when shorting, then you can pay the premium of owning its put option contracts at some out of the money strike prices then all you will risk is the premium you pay for the option contract.

Monday, October 27, 2008

Lehman Brothers Tragedy, how to avoid?

LEHMQ - LEH before kicked to pink sheets


How do we avoid being robbed?  Even when the financial advisors at your bank convince you to purchase their bonds?  When the stock price of a company is shooting down like this, the chances are that their products are not that great.  The last time Lehman Brothers had a daily rise ended in Mid-Feb, 2008.  Let's say you were optimistic about it all the time before, all the indicators stayed bearish after Mid-Feb, 2008 and you have no reason to be bullish to it.


The plunge of the Canadian Giant fertilizer & products producer NYSE:POT

Potash has been really hot in North American markets since 2007, who would guess its share price would plunge 75% from its June 2008 high?  The answer is we do not need to guess, the charts tell us all.


So why does a fertilizer company get affected by this credit mess?  I think the energy price drags down the commodities & energy sector.  Energy drives up food prices so food prices are dragged down by energy price drop.  Therefore the fertilizers price drop as well.

Just for your interest, corn futures down 51% from its high in June, 2008 high.  Soy futures down 45% from July, 2008 high.

Sunday, October 26, 2008

Gold Movement Oct 27th, 2008

Today let's take a look at Gold, there might be a few reasons to drive the gold down.  

1)  Down fall of oil
2)  Rise of USD
3)  Bearishness of commodities due to fund liquidations

Anyhow, we don't really need to know the real reason.  The chart shows Gold has broken is recent major support around 739.8.  All the indicators are bearish, we need to wait for the first impulse before going bullish on Gold again.

One of the biggest lesson I learnt, never fight the trend.  The probability is against you when you fight the trend.  You might get a few winners off countertrend moves, but in the long run the odd is against you.


Saturday, October 25, 2008

The Fall of Crude Oil Futures

I wonder who is still long in oil, it has long been declared bearish.


Swing vs Day Trading

Is swing trading safer and more profitable than day trading?

What I used to think are advantages as day trading:
1.  No over night risks
2.  Can set smaller stop-loss cushion
3.  Intraday swing is my friend


What I tend to think after a year of observation:
1.  Over night risk is not against you as long as you are trading with the trend.
2.  Avoid emotion and can place multiple orders at multiple times.
3.  Signals are smoother when swing trading, intraday signals seem to induce much noise.  So not every swing comes signaled entry.


A few sites I often read:

www.afraidtotrade.com
www.stocktock.com

A couple of sites that can be useful:
www.stockcharts.com (Many indicators to choose from)
www.marketclub.com (Not many charting sites offer web-based futures charts, also their tradetriagle technology is also worth mentioning)